I know it’s been a while, but here I am. It has been a journey for me these last few months, gradually morphing myself into a data analyst. While that may become a separate post soon, today I wanted to talk about some interesting data I’ve been working with recently.
No, I won’t be diving into the technical details behind my analysis; why I did what I did, and so on. No, for most people that would be too boring. My future employers may appreciate it but I know that most of you are here for the juicy narrative, which I’ll focus on today.
I found a dataset on Denver’s open catalog that contained all traffic accidents that have occurred in the city of Denver for the last 10 years: when it happened, where it happened, why it happened, what the conditions were like, how severe was it, etc. While having that many variables to work with can be a data analyst’s wet dream, it can also overwhelm the casual viewer.
For those of you who live in Denver, I will attempt to boil it down to the bare necessities so that you can take some practical insight from this.
Take home #1: A lot of accidents happen during rush hour. And in the middle of the night.
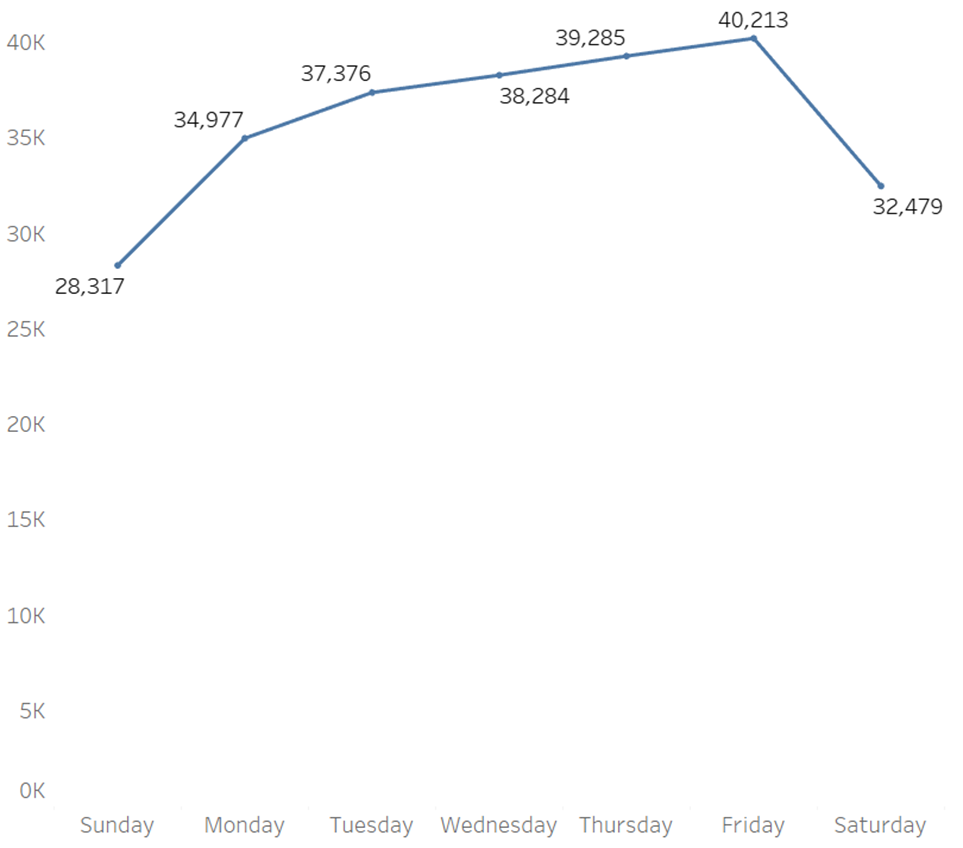
As you can see, accident numbers gradually rise each day starting Monday, with peak accidents occurring on Fridays. Saturday and Sunday are significantly lower.
Let’s unpack this. The quick insight to pick out is that most accidents happen during the week. Hmm, what’s going on during the week? Oh yeah, people are commuting to their jobs. Yes, we live in a post-COVID era, but still. A lot of people work on-site daily, or at least have to go in a few times per week.
But wait- what does an hour-by-hour analysis show us? Cue the next line graph:
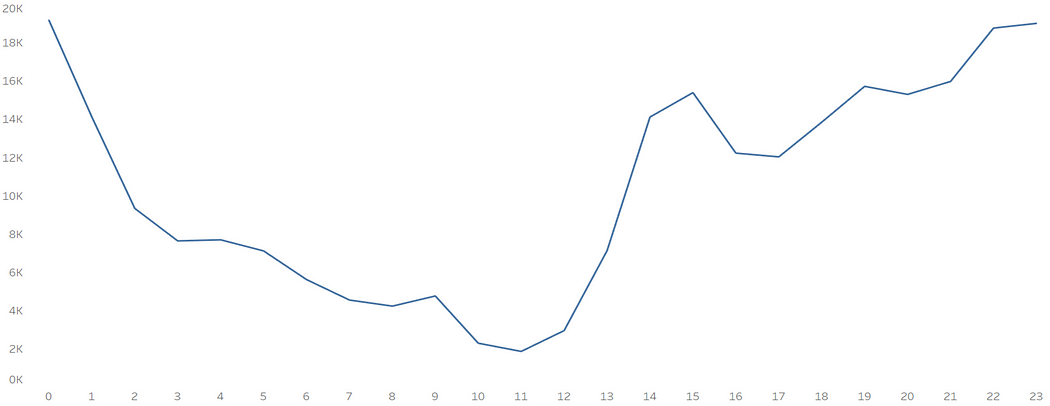
Hmm, that’s interesting. Most accidents happen at night? Is that right? Well, as you can see, there’s a peak starting around 3 pm, a slight dip, then it builds from 6 pm through midnight.
While rush hour has the highest volume of drivers, thus leading to an increase in car accidents, the most dangerous times to drive are at night (think: low visibility, more inebriated drivers).
Wow John, you’re really blowing my mind (eye roll)…seriously though, what can you tell me that I don’t already know?
Good point, make-believe critic. The true take-home in this case is that driving between 10 am and 12 pm is the safest time of day to drive. Everyone’s working, no one’s commuting. Go run those errands!
Take home #2: the most severe accidents happen on highways and interstates. Or do they?
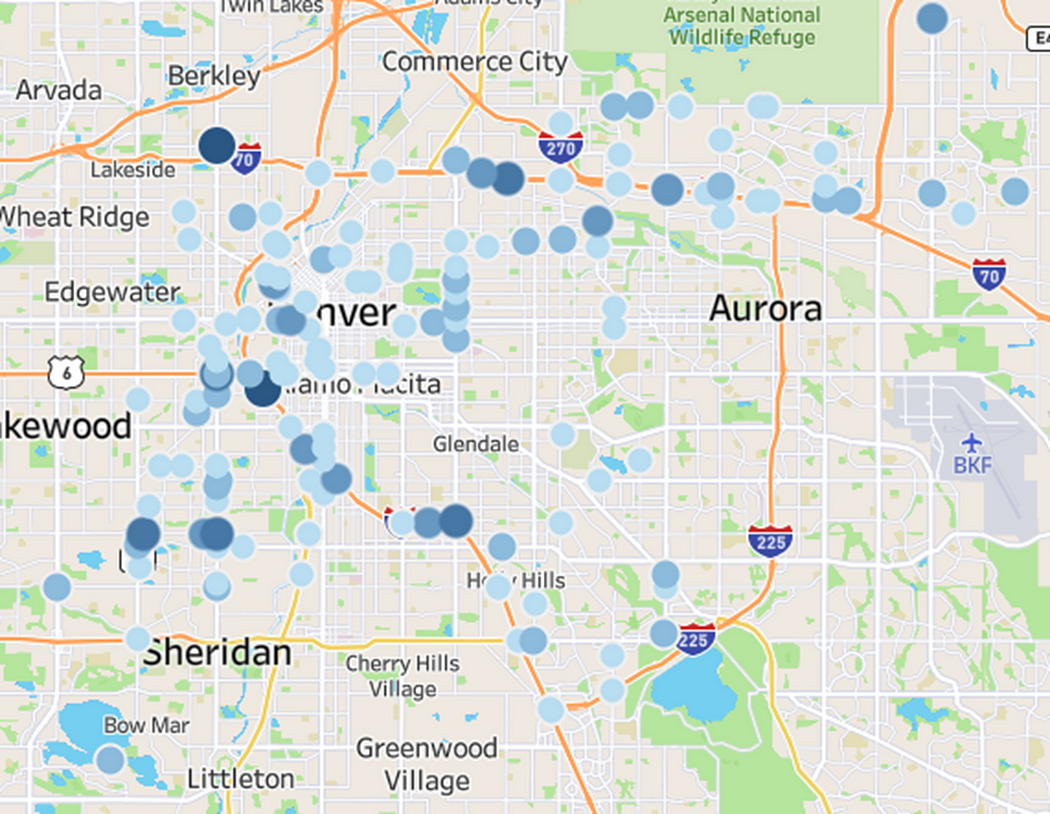
This may be another “no shit, Sherlock” moment, but hear me out. This map shows all accidents that lead to at least 3 serious injuries (requiring hospital intervention) or fatalities. As you can see, most are clustered on or around the major throughways of Denver: I25, Hwy 6, I70. Giving an ounce of thought to this can tell us why: people on those throughways are driving fast as hell, which means higher-velocity collisions.
Okay, fair enough. I’ll just take the streets as much as I can.
But wait, that wouldn’t be the whole picture! See how some other city streets see a lot of severe accidents? Don’t you want to know what’s going on there?
Yes, you do. And I’ll tell you because I’m gracious. Yes, there are a few main city streets that see a lot of volume, have higher speed limits, and thus see more severe collisions. These streets are:
Federal Blvd (9,942 accidents)
Colorado Ave (9,378 accidents)
Quebec St (6,250 accident)
Broadway (5,795 accidents)
Sheridan Ave (4,684 accidents)
University Ave (3,018 accidents)
This means that most of these places have seen 1–2 accidents a day over the last 10 years. Yowzah!
Take home #3: Avoid industrial neighborhoods, instead drive through the walkable areas.
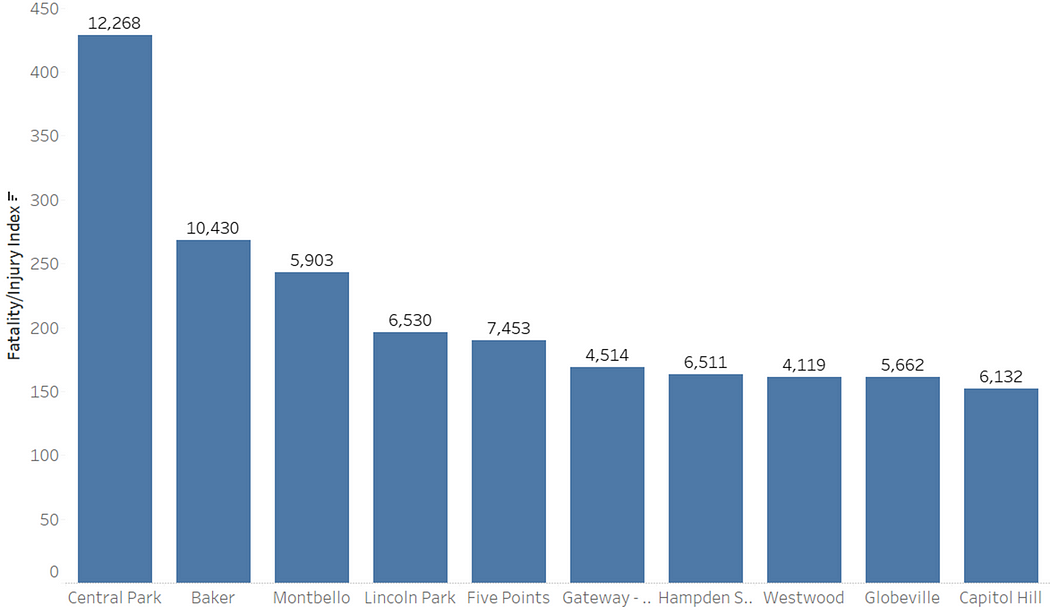
This shows the most dangerous neighborhoods by total volume and severity of accidents. Central Park (which isn’t central at all- it’s in the northwest corner of the city) comes in on top, averaging over 3 accidents a day over the last 10 years.
The rest of these neighborhoods aren’t much better- all of them averaging around 1–2 accidents per day.
Great. You keep telling me what not to do. Can you at least tell me which neighborhoods are safest?
Surely! Check out this chart, which shows the safest areas to drive through.
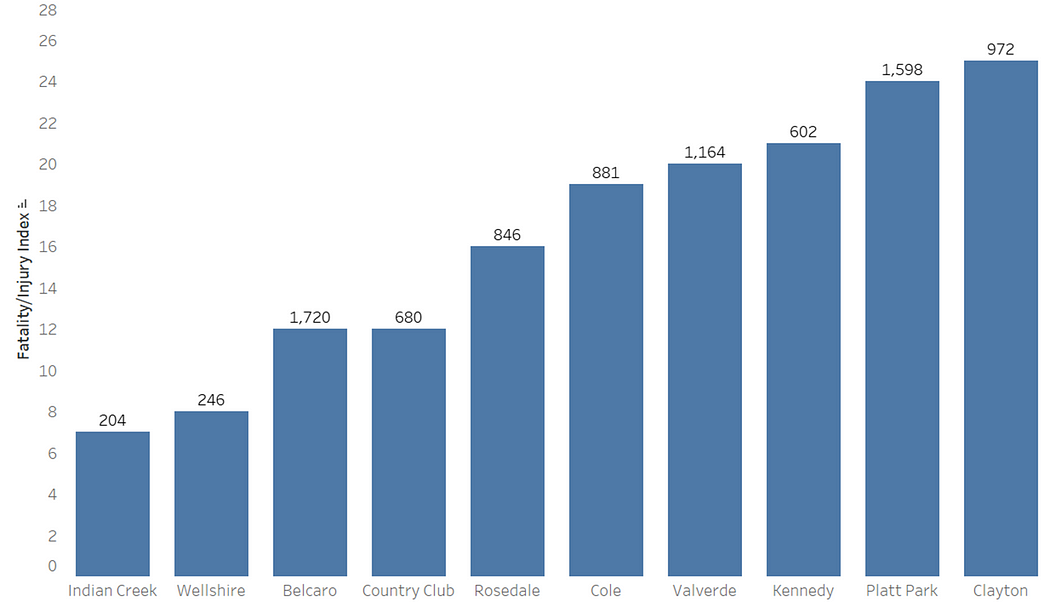
Funny enough, I’ve lived in one of the safest neighborhoods (Platt Park) and the most dangerous (Central Park), completely unbeknownst to me.
So what qualities do the most and least dangerous neighborhoods share? Well, the dangerous ones are in and around industrial areas and highways. Higher volume, higher speeds, more trucks, and non-traditional vehicles.
And the safest? They’re walkable. Yup, the farmer’s market-type spots. The places where people love to come and walk on the weekends. There’s a high concentration of people there, but that’s the advantage- high pedestrian traffic equals slower driving speeds equals less collisions equals less injuries and fatalities.
Last take home: the GOAT of driving conditions.
As I mentioned earlier, this dataset had a lot of data. There is too much to thoroughly flesh out in a blog post and too much for most people to care about. For this last point, I compiled the safest driving conditions that will keep you all out of harm’s way. Let’s get into it.
When to drive: on the weekends, or between the hours of 10 am and 12 pm.
Where to drive: walkable neighborhoods. Avoid highways and busier thoroughfares.
Best road conditions: dry, of course. You think driving in the rain or snow is a good idea?
Avoid drivers who are: careless, distracted, driving too closely, or don’t slow down to yield when necessary. This is hardly something we can control, but those are the top reasons why accidents occur. You can use this information to avoid those areas where these drivers may be (think universities- we know the youngest drivers are the most likely to drive distracted or impatiently).
And that’s it, folks. I hope you got something practical out of this; or at the very least, experienced one iota of entertainment from my half-assed attempts to keep this light-hearted and witty. Wait, one more thing.
Bonus take-home: don’t be afraid. Thank COVID-19 for making the streets safer.
Spending all this time looking at car accident data, it can be easy to start feeling uneasy about driving during busy times. To end this post on a hopeful note, I want to show you one more graph: the year-over-year traffic accident totals.
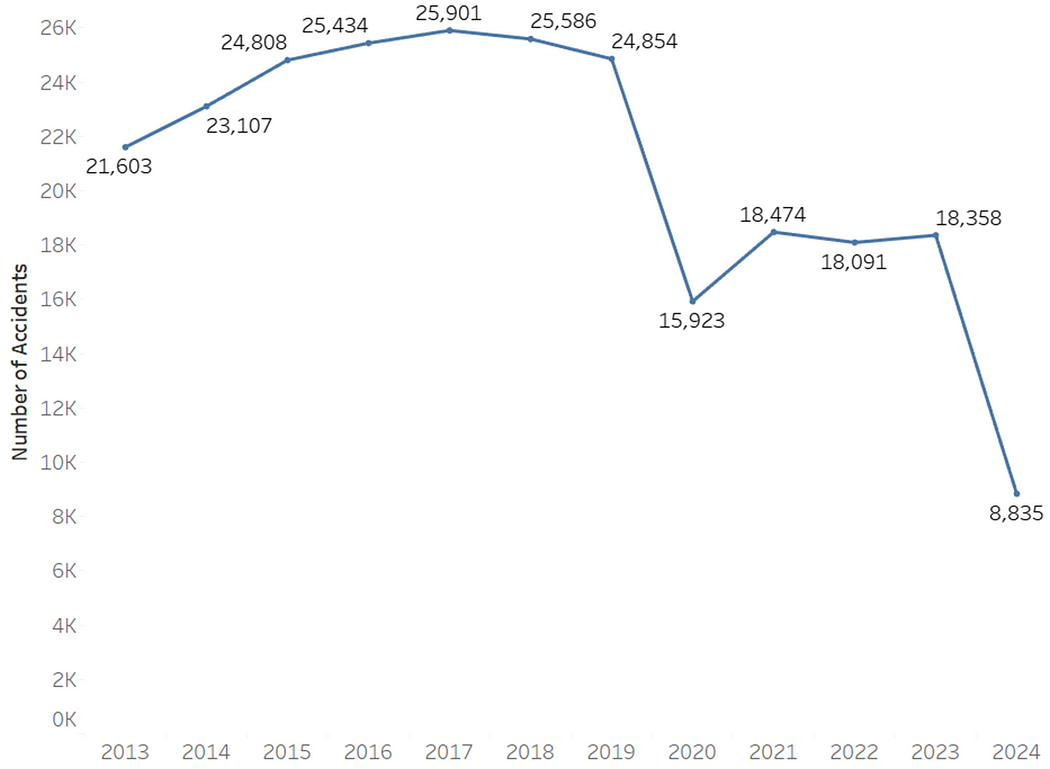
Notice something interesting? Perhaps that giant downturn that happened in…2020? Hmm, what was going on that year? Oh yes. Life as we knew it shut down. For a while. Cue remote work, empty grocery store shelves, and large numbers of people staying home.
That’s a nice downtick in accidents. Sure there was a slight rebound, but still. The last four years have seen a 28% decrease in total accidents compared to the previous seven. Now that’s something to write home about!
