Project Overview
- Overview: Denver, the most populous city in Colorado, has grown considerably since the turn of the millennium. This project provides information regarding crime rates, behavior, and other factors associated with crime in a moderately large US city.
- Motivation: This analysis attempts to uncover trends and patterns in crime rates and behaviors in the Denver Metro area over the last 5 years.
- Agenda: To understand the different factors affecting crime by asking these questions:
- Do crime rates have a seasonality to them?
- Which neighborhoods are the most dangerous?
- What socioeconomic factors are associated with more crime?
- What are the most common types of crime?
Data Details
- Datasets: Denver Crime, Denver Demographics
- Source: Denver Open Data Catalog
- Data collection period: January 2018 to September 2023
- Tools, skills, and methodologies:
- Python utilized for exploratory data analysis, data cleaning and wrangling, dataset merging, and cluster analysis.
- Libraries used included pandas, NumPy, matplotlib, seaborn, folium, json, and sklearn.
- Tableau storyboard showcased in-depth analyses and findings.
- GitHub repository for more scripts and other analytical details found here.
Exploratory Data Analysis (EDA)
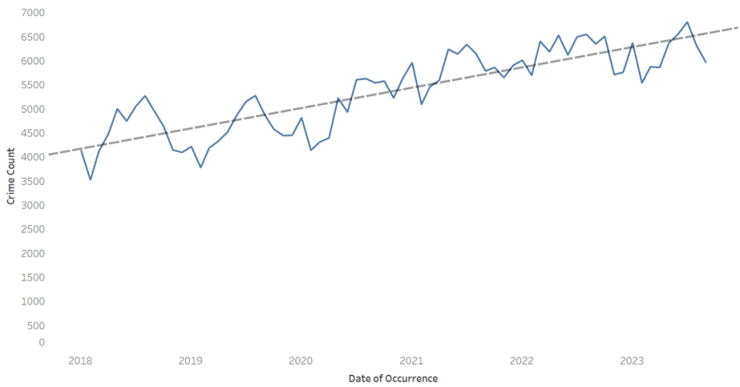
- After the necessary cleaning, wrangling, and merging of the two datasets, I started with a simple EDA to familiarize myself and attempt to uncover any surface-level trends or patterns.
- This quickly revealed to me one main takeaway: crime rates have been increasing.
- The logical next question is: why are crime rates going up?
Linear Regression, Cluster Analysis and Next Steps
- After running a linear regression and a cluster analysis attempting to uncover variables most involved with higher crime rates, I attained inconclusive results.
- Refer to the full Tableau storyboard here.
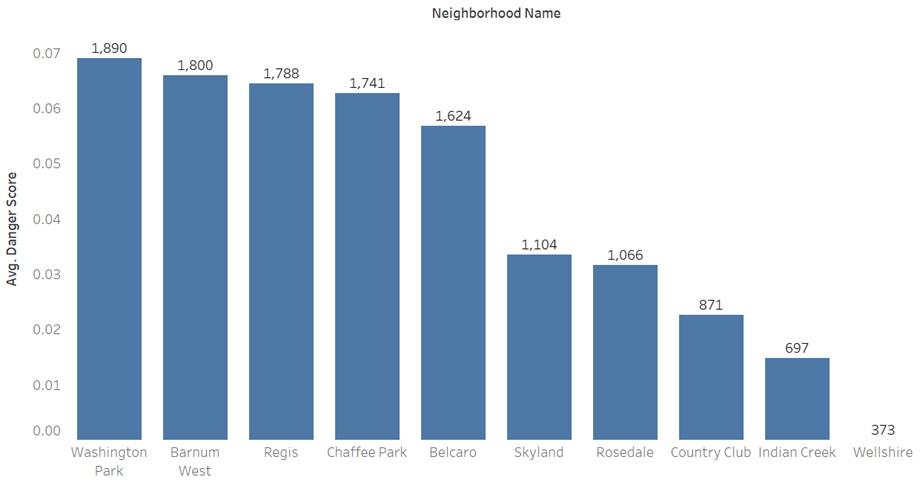
- Using a correlation heatmap, I did find some key socioeconomic variables that showed moderately strong correlations to crime rates.
- This in conjunction with crime rates by neighborhood allowed me to create a composite “danger score” which ranked all 78 of Denver’s neighborhoods.
Conclusion and Takeaways
- While more work can be done to deepen this analysis and gain a higher resolution picture, I did find some important aspects of crime to help guide citizen behavior.
- On top of the neighborhood rankings, I also uncovered the most popular day of the week for crime to occur, as well as the months of the year.
- In addition, the most common types of crime were uncovered and ranked.
- For the entire story including recommendations, please refer to the full presentation below (and check out my blog post on this project).
