Project Overview
- Motivation: This analysis attempts to uncover trends and patterns among traffic accidents in the Denver Metro area over the last 10 years.
- Agenda: Attempt to understand general accident behavior by asking these questions
- Where are the accidents usually?
- Which locations are the most dangerous?
- How do the accidents look over time?
- What is the common cause of these accidents?
Data Details
- Source: Denver Open Data Catalog
- Run by the city and county of Denver, it is a public access website for various data sets involving transportation, public safety, education, etc.
- The dataset was first published in 2020, and last updated in June 2024
- Data collection period: January 2013 to June 2024
- Tools, skills, and methodologies:
- Python was utilized for exploratory data analysis, data cleaning, and manipulation.
- Libraries used included pandas, NumPy, matplotlib, and seaborn.
- Created Tableau visuals to help communicate findings.
- GitHub repository for scripts and other analytical details can be found here.
Exploratory Data Analysis
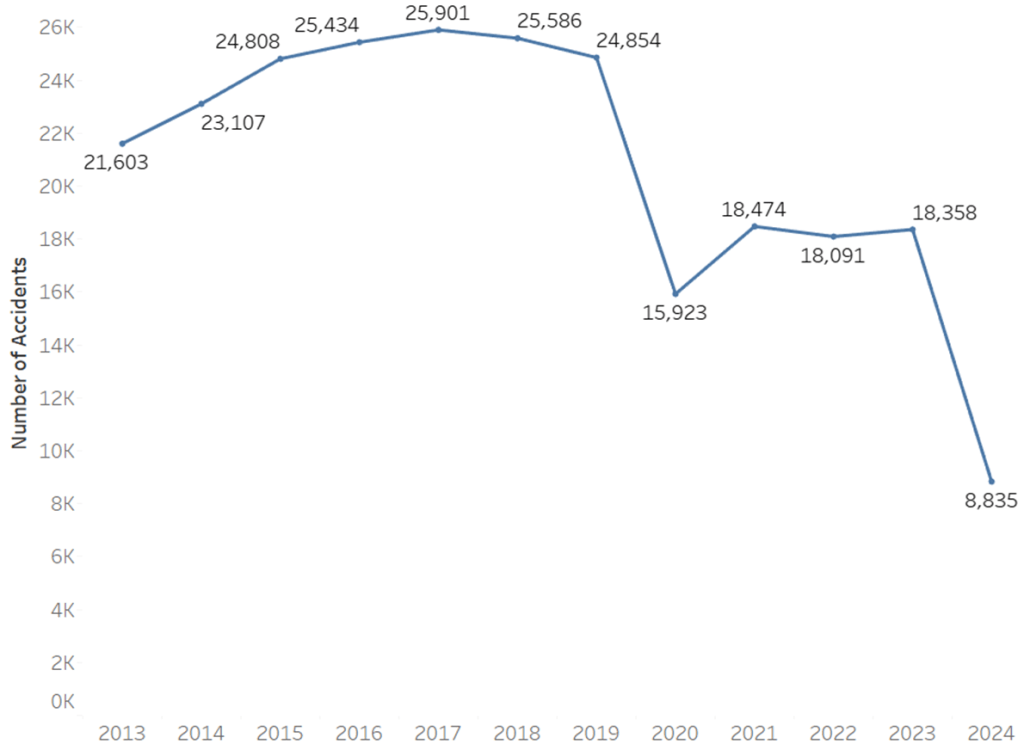
- I started with a time series analysis to determine how traffic accidents have (or haven’t) changed since 2013.
- The line graph below shows gradual increases from 2013 to 2019 (reflecting population growth), followed by a stark dropoff in 2020.
- What happened in 2020? Oh yeah, COVID-19. The world shut down for a period of time, and remote work took off.
Further Analysis and Next Steps
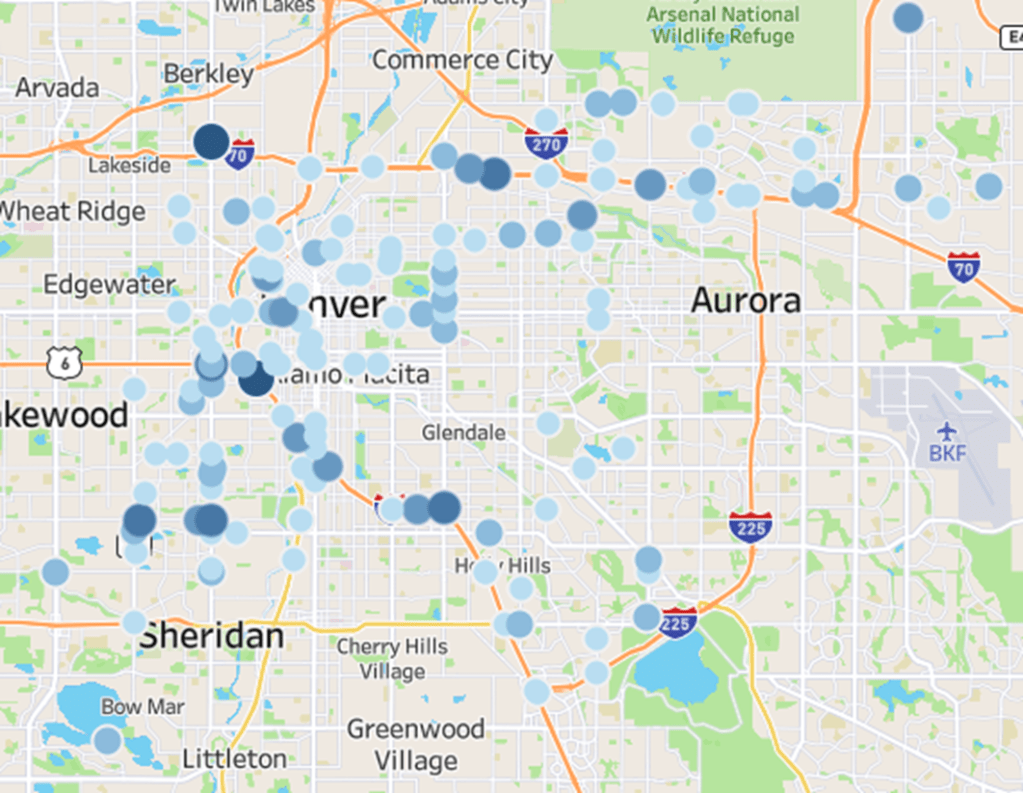
- I derived a “Fatality-Injury Index” (FII) which is the summation of fatalities and serious injuries from each accident.
- From there, I plotted all major accidents (with an FII of at least 3) to visualize which areas in the city see the most serious accidents.
- The more serious the accident, the bigger and darker the blue dot is.
- As you can see, and perhaps unsurprisingly, a lot of the worst accidents are located on or near major highways (I70, I25, or HWY 6).
- Highway driving = faster speeds= faster collisions = higher possibility for serious injury or death.
Conclusion and Takeaways
- This analysis provided me with a few useful pieces of information that can help inform city drivers
- I determined the safest time of day to drive, the safest days of the week, the most dangerous roadways, a ranking of the city’s most and least dangerous neighborhoods for accidents, and more.
- For the full story, please refer to the presentation below (and check out my blog post on this project).
